Deal-Level Examination of China’s Outbound M&A in the US (2002-2014)
North America remains the top destination for Chinese outbound investment, particularly in the high technology, industrials, and consumer products and services industries.

by Kaiwen Zhong, BA ’15
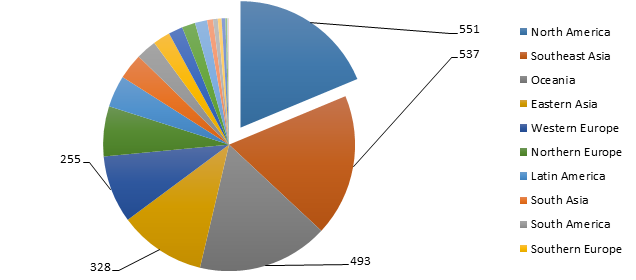
The last few decades witnessed China’s thriving economy. While the country has been a popular destination for cross border investments and mergers and acquisitions, it recently started getting attention for its outward investment and acquisition deals. The United States and other developed countries in North America and Europe have become increasingly attractive target destinations for Chinese acquirers. According to data in Thomson Reuters M&A Platinum Database, while many Chinese companies[1] still prefer buying shares and companies in Southeast Asia and Eastern Asia, among the 2944 completed or withdrawn deals from China between 2002 and 2014, there were 551 deals to North America, the top destination for Chinese M&A deals, followed by Southeast Asia, Oceania, Eastern Asia, and Western Europe, as shown in Figure 1. The top five destinations of Chinese M&A investments remain the same for completed deals, contrary to the perception that Chinese companies prefer investing in Southeast Asia and East Asia.
Figure 1: Total number of completed and withdrawn M&A deals from China to regions across the world (2002 – 2014) [2]
We compiled and analyzed a dataset of all completed and withdrawn M&A deals from China to the United States between January 1st, 2002 and December 31st, 2014, recorded by Thomson Reuters M&A Platinum Database, excluding exchange offers, rumors, and repurchases. There are 376 deals in this dataset, with a total volume of $71.27 billion[3].
Among these deals, 349 are completed, totaling $42.50 billion. The numbers show that the average deal size of completed deals is $121.7 million, whereas the average size for withdrawn deals is $1065.9 million. The fact that the size of withdrawn deals is larger (in this case, almost ten times larger) is not surprising. Larger deals could mean that the acquirers buy more controlling stakes in the targets, which leads to more regulation barriers and more complicated negotiation processes. On the contrary, smaller deals are less complicated in areas like regulations and negotiations. Therefore, withdrawn deals tend to be larger.
In terms of the historical fluctuations of M&A deals from China to the United States, Figure 2 shows that the total transaction volume reached its highest in 2005, prior to the recession in 2007, whereas the number of deals increased post recession, between the year of 2008 and 2012. The average volume of each transaction is the highest in 2005, which might mean that acquirers tend to take larger risks due to factors such as pre-recession economic growth and China’s favorable Going Out Policy[4]. On the contrary, the average deal volume is smaller post recession. This might reflect that many Chinese companies sought financial investments and opportunities in the United States during this period, but were more risk-averse. Moreover, it was easier for the Chinese acquirers to find companies with lower prices in the United States during the recession.
Figure 2: Time Series of M&A Number and Volume of Deals from China to the United States (2002 – 2014, volume in $million)
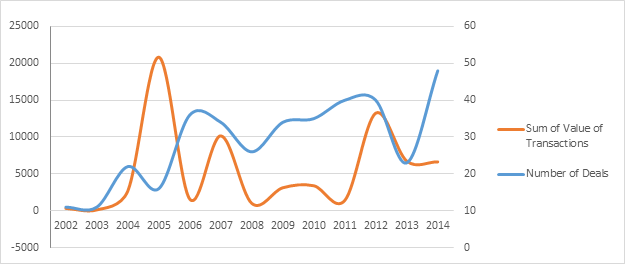
Figure 3: Number of M&A Deals from China to the United States by Industries by Year (2002 – 2014)
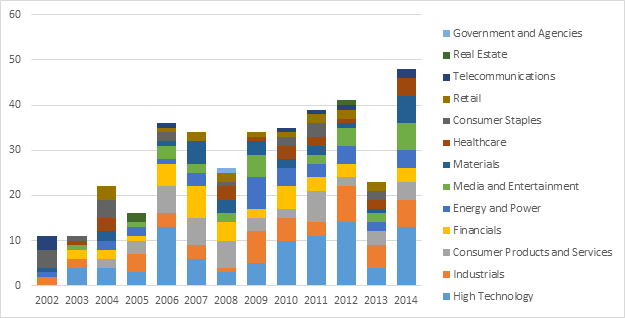
Regarding industry spread, most deals from China to the United States are in the high technology, industrials (manufacturing), and consumer products and services industries, as evidenced in Figure 3, while the industry that attracts the highest volume of M&A investment and has the largest average deal size is energy and power[5]. Furthermore, most Chinese acquirers are from financial services background, followed by high technology. Interestingly, most M&A deals from China to the United States are among companies of different industries. Specifically, there are 191 deals across different industries. This might be because most acquirers from China are financial services firms, and they invest in American firms to diversify their portfolios.
This examination of deal-level information from China to the United States reflects interesting findings about the historical fluctuations, completion information, and industry spread of the transactions. As the United States and other developed countries continue to receive more investments from China, more questions are naturally brought up. For example, who are the acquirers? Where and what are they investing in? How are they performing? Some of these questions are being explored while more deserve future research attention.
[1] Hong Kong and Macau are included as part of China in this article
[2] All of the charts attached to this article are compiled from data in Thomson Reuters M&A Platinum Database.
[3]This number might be different from data from other databases, such as UNCTAD M&A Annex tables. One reason is that, although considered one of the best databases regarding M&A information, Thomson Reuters M&A Platinum Database does not have information regarding transaction volumes for some deals, especially deals where both the target and the acquirer are target companies.
[4] Going Out Policy an initiative by the Chinese government that encourages Chinese companies to go abroad and invest overseas. (Sandeep Sudan, China’s “Going Out” Strategy: Increasing Overseas Expansion, www.pinkerton.com, 2014)
[5] To find the Industry of the acquirers and targets, the researcher choose the “macro industry of acquirer” and “macro industry of target” options in Thomson Reuters when it executes data output.