Emerging Heavyweights: The Surge of the E20
At the Emerging Markets Institute at Cornell University, we identify 20 Emerging Markets, which we call E20, which we consider the new “heavyweights” of the world economy—those economies that have and are expected to have an increasing influence in the rest of the world for the years to come.
The characteristic used to define these emerging markets are the economic size as measured by gross domestic product (GDP), current level of development, trajectory towards mature economy status, level of integration into the global economy, and the potential to play a significant role in the world economy.
Seven of these economies are in Asia, namely China, India, Indonesia, South Korea, the Philippines, Malaysia and Thailand. Asian countries represent 70 percent of the E20 GDP, with China alone half of the total size of E20, and the world’s biggest trade partner for 100 countries including the U.S.
The power of Asia shows in the demographics as well—with its young population a source of untapped wealth because of its skills, size of the workforce and consumer market. In fact, the percentage of the working age population is also increasing in the E20 group. This can have a significant positive impact on growth (the so-called) “demographic dividend”) and generate a window of opportunity for the new heavyweights, which will have to invest in education and health to generate more development opportunities for their people.

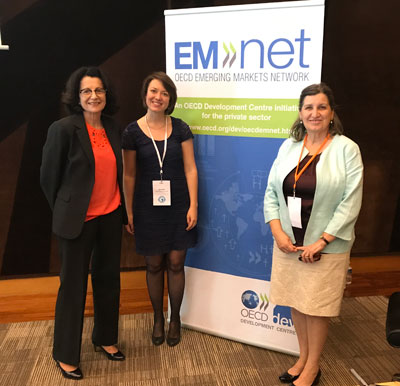
At the OECD presentation in Paris
Another key strength is economic performance. While the E20’s GDP in purchasing power parity (PPP) grew annually by 7.4 percent between 1995 and 2015 on average, that of the G7—the seven major advanced economies, namely Canada, France, Germany, Italy, Japan, the UK and the U.S.—only grew by 3.6 percent. Since 2000, the E20s’ share in global GDP (PPP) has grown by 15 percentage points to 46 percent in 2015, while that of the G20 has fallen from 44 percent to 31 percent.
The strength of these economies is illustrated by the fact that every G7 economy grew slower than every E20 economy between 1995 and 2015.
But there are also challenges ahead for the E20 as some of them are aging rapidly. Take China: while 15 percent of its population is above 60 years old, this ratio will reach 25 percent by 2030; and the ratio will be 30 percent for South Korea by the same year. This will generate pressure on social expenditures, and potentially on economic growth as well, going forward.
Separately, some aspects of emerging markets have not changed in the last two decades, such as their volatility to external shocks and currency volatility—for example, Mexico in 1994, Asia in 1997, and multiple crises in Russia, Argentina and Brazil since 2000.
And despite the optimism around the growth rates in these economies, there are concerns around potential financial problems in economies such as China that may stem from the significant increase in its domestic debt, on which such growth has been partly dependent.
Moving Ahead in Technology and Innovation
Technology and innovation, key drivers of growth and development, plays a critical role in many of the E20 members’ agendas. The Global Innovation Index[1], which shows the performance of 128 economies in innovation, illustrates importance of EMs. Seven E20 countries are among the top 50 according to the index. Korea (11) – and to a lesser extent China (25) – are at the heels or even already outperform some developed markets such as Netherlands (9), Germany (10), Canada (15), Japan (16), France (18), Spain (28) and Italy (29).
The E20 countries are an important source of innovation because they have particular needs to satisfy. Mobile banking, for example, emerged in response to low levels of financial inclusion, particularly in rural areas. Other examples of IT based innovation in agriculture or fishery such as M-Farm, a virtual cooperative where farmers share knowledge in Kenya[2] or the mobile application Fisher Friends in India[3] where fishermen exchange useful information. Both show that the E20 group constitutes a powerful source of new ideas to improve the quality of life in the world.
Research and development (R&D) expenditure as a share of GDP is another indicator that shows improvements among E20 economies. Korea again is the best performer, with an R&D intensity ratio (ratio of R&D expenditures to GDP) of 4.15[4]. An honorable mention goes to China, which multiplied its R&D expenses by five in just a decade; its R&D intensity ratio doubled to 2 percent in the same period, making it the country with the second largest R&D expenditure in the world[5].
Backing up the R&D expenditure is the focus on education policies, something many E20 economies are working on to improve. The emerging economies with the biggest education expenses over GDP are South Africa (6 percent), Malaysia (5.9 percent), Brazil (5.6 percent), and Argentina and Mexico (both 5.1 percent)[6]. Surprisingly, these ratios are similar to those found in the G7.
The focus on R&D and education is yielding results already. For example, patent filings constitute another area in which the E20 has reduced the gap with the G7. In 1994, the latter group filed 61 percent of the world’s patents, while emerging economies filed only 15 percent. By 2014, the E20 was responsible for 37 percent and G7 for 50 percent of filings. China and Korea were the main drivers for this exceptional growth, accounting for 20 percent and 11 percent of patents granted globally in that same year[7].
Even as Internet penetration is uneven across E20 countries, mobile phone penetration has greatly fostered development in the group by encouraging entrepreneurs and providing basic public services like health and education. Broadband penetration among E20 economies is now higher than the world average, but lower than developed economies.
Beyond Economic Power
E20 countries are also acquiring “soft power” through new global governance and international cooperation mechanisms. Some examples can be found in the creation of the G20, the BRICs summits, and the new developmental institutions—the Bank of the South (2009), the New Development Bank (2014) and the Asian Infrastructure Development Bank (2015). A crucial reason is that the power structures in these organizations are different from that in the older, global multilateral institutions.
For instance, China, India and Russia are the biggest contributors to the AIIB, which has 57 members, including four G7 countries. Besides providing an opportunity to emerging markets to take economic decisions on their own, the new institutions and initiatives are likely to bring other benefits as well, such as increasing the importance of the renminbi in the currency markets in the case of China. Moreover, after the renminbi was included in the Special Drawing Rights currency basket, its potential to become a significant international reserve currency has increased.
Emerging countries are arguably ready and willing to play a bigger role in world affairs. Even if they remain very diverse and their economies volatile, they have redefined the balance of power in the world. And no matter how much volatility the E20 may experience, the influence these countries wield will continue to increase. They have enjoyed strong and steady growth in the past 20 years, and the new scenario resulting from that growth is one of a new balance of power, opening up new opportunities, and also a step into unchartered territory.
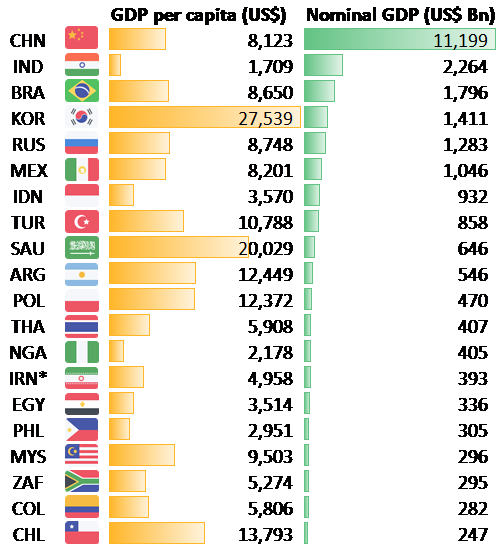
Figure 1: The E20 Emerging Economies – Ranked by Nominal GDP in 2016

*For Iran, values are from 2014 since 2016 data is not available.
Source: Based on data from the World Bank (World Development Indicators / accessed July 2016)[8]
[2] Source: https://qz.com/603214/i-built-a-mobile-app-to-help-africas-farmers-but-our-countries-infrastructure-must-work-too/.
[4] See UNESCO Statistics, UIS Stat http://data.uis.unesco.org/.
[5] OECD, STI profile, China https://www.oecd.org/sti/outlook/e-outlook/sticountryprofiles/china.htm.
[6] See World Development Indicators. http://data.worldbank.org/data-catalog/world-development-indicators.
[7] Emerging Market Multinationals Report: The China Surge http://bit.ly/eMNCreport and data from the International telecommunications Union (ITU) http://www.itu.int/en/ITU-D/Statistics/Pages/stat/default.aspx.
[8] The article was also published at http://www.brinknews.com/asia/emerging-heavyweights-the-surge-of-the-e20/
